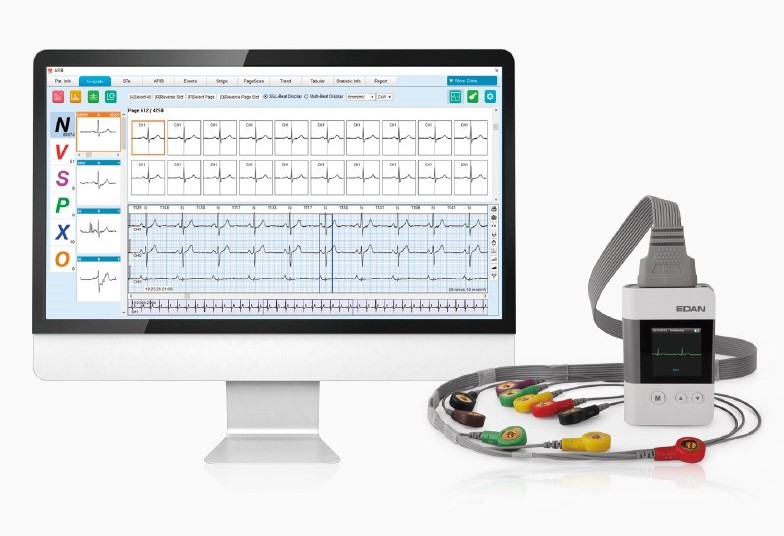
ECG Holter

Combining the commonly used functions together, the top toolbar can also be redefined based on user preference, creating a customizable, personalized, and comfortable workflow for every cardiologist.
Finding the distinct beats is always time-consuming. Edan provides multiple graphical tools, helping users locate and select the abnormal parts by picking the corresponded graphical elements.
1. The R-R Histogram presents the full group of recorded RR intervals, helping locate the distinct beats easily.
2. The Waveform Superposition Heat Map exposes abnormal beats on overlapped waveforms.
3. The Lorenz Plots (Poincare Plot) helps identify those beats with nonhomogeneous beat-to-beat variability.